


미국 에너지정보청(EIA)은 18일 8월 에너지 전망보고서(US Energy Information Administration Short-Term Energy Outlook August 2017)를 발표했다.
<도표 참조>
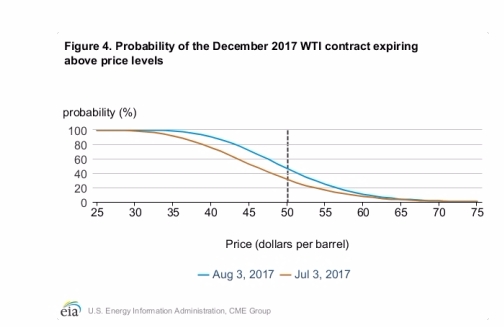
배럴당 60달러 이상으로 오를 확률도 10% 이상에 달하는 것으로 전망됐다.
EIA는 국제유가가 올라갈 것으로 보는 근거로 "전 세계의 원유 공급 상승세가 다소 꺾일 가능성이 있다"는 사실을 들었다.
미국의 셰일가스 생산 증가세가 주춤한 가운데 OPEC 국가들이 추가감산을 추진하고 있다는 것이 그 이유이다.
여기에다 세계경제의 회복세도 빨라 수요 증가가 예상을 웃돌고 있다는 점도 국제유가 상승의 한 근거로 제시됐다.
도널드 트럼프 미국 대통령의 최측근으로 알려진 스티브 배넌 백악관 수석전략가는 이날 북한의 핵·미사일 발사와 관련하여 "군사적 해법은 없다"고 말했다.
CNN은 배넌이 재래식 무기 공격으로 서울의 1000만명이 죽지 않을 수 있다는 방정식을 보여줄 때까지 군사 해법은 없다고 발언했다고 보도했다.
군사적 해법 없다는 백악관 배넌 발언 이후 환율, WTI, 뉴욕증시 등 금융시장 지표가 영향을 받고 있다.
다음은 미국 에너지 정보청의 국제유가 전망보고서
Short-Term Energy Outlook (STEO)
Forecast highlights
Global liquid fuels
• North Sea Brent crude oil spot prices averaged $48 per barrel (b) in July, $2/b higher
than the June average and almost $4/b higher than in July 2016. EIA forecasts Brent spot
prices to average $51/b in 2017 and $52/b in 2018. West Texas Intermediate (WTI)
crude oil prices are forecast to average $2/b less than Brent prices in both 2017 and
2018. NYMEX contract values for December 2017 delivery that traded during the fiveday
period ending August 3 suggest that a range of $37/b to $68/b encompasses the
market expectation for December WTI prices at the 95% confidence level.
• U.S. regular gasoline retail prices averaged $2.30 per gallon (gal) in July, down 5
cents/gal from the average in June but 6 cents/gal higher than in July 2016. During the
April-through-September summer driving season of 2017, U.S. regular gasoline retail
prices are forecast to average $2.37/gal, 14 cents/gal higher than last summer. Annual
average U.S. regular gasoline retail prices are forecast to be $2.33/gal in both 2017 and
2018.
• U.S. crude oil production averaged an estimated 8.9 million barrels per day (b/d) in 2016
and is forecast to average 9.3 million b/d in 2017. EIA forecasts crude oil production to
average 9.9 million b/d in 2018, which would mark the highest annual average
production in U.S. history, surpassing the previous record of 9.6 million b/d set in 1970.
• EIA forecasts that global petroleum and liquid fuels inventories will be largely
unchanged in 2017 and then increase by an average of 0.2 million b/d in 2018.
Natural gas
• U.S. dry natural gas production is forecast to average 73.5 billion cubic feet per day
(Bcf/d) in 2017, a 1.2 Bcf/d increase from the 2016 level. Natural gas production in 2018
is forecast to be 3.9 Bcf/d above the 2017 level.
• In July, the average Henry Hub natural gas spot price was $2.98 per million British
thermal units (MMBtu), about the same as in June. Higher natural gas exports and
growing domestic natural gas consumption in 2018 contribute to the forecast Henry
Hub natural gas spot price rising from an annual average of $3.06/MMBtu in 2017 to
$3.29/MMBtu in 2018. NYMEX contract values for December 2017 delivery that traded
U.S. Energy Information Administration | Short-Term Energy Outlook August 2017 2
during the five-day period ending August 3 suggest that a range of $2.17/MMBtu to
$4.48/MMBtu encompasses the market expectation for December Henry Hub natural
gas prices at the 95% confidence level.
Electricity, coal, renewables, and emissions
• Total U.S. electricity generation from utility-scale power plants averaged 11,145
gigawatthours per day in 2016. Forecast U.S. generation declines by 1.2% in 2017, which
mostly reflects expectations of milder temperatures in the third quarter of 2017
compared with the same period last year. Forecast generation grows by 1.8% in 2018
based largely on a forecast of colder temperatures during the first quarter 2018
compared with the same period in 2017 and on the expectation of a growing economy.
• EIA expects the share of U.S. total utility-scale electricity generation from natural gas to
fall from an average of 34% in 2016 to about 31% in 2017 as a result of higher natural
gas prices, increased generation from renewables and coal, and lower electricity
demand. Coal's forecast generation share rises from 30% last year to almost 32% in
2017. The projected generation shares for natural gas and coal are nearly identical in
2018, averaging between 31% and 32%.
• Coal exports for the first five months of 2017 were 37 million short tons (MMst), which
was 60% higher than coal exports over the same period last year. EIA expects growth in
coal exports to slow in the coming months, with exports for all of 2017 forecast at 70
MMst, 17% above the 2016 level. The increase in coal exports contributes to an
expected 58 MMst (8%) increase in coal production in 2017. In 2018, coal production is
forecast to increase by 10 MMst (1%).
• Wind electricity generating capacity at the end of 2016 was 81 gigawatts (GW). EIA
expects wind capacity additions in the forecast will bring total wind capacity to 88 GW
by the end of 2017 and to 102 GW by the end of 2018.
• Total utility-scale solar electricity generating capacity at the end of 2016 was 22 GW. EIA
expects solar capacity additions in the forecast will bring total utility-scale solar capacity
to 29 GW by the end of 2017 and to 32 GW by the end of 2018.
• After declining 1.7% in 2016, energy-related carbon dioxide (CO2) emissions are
projected to decrease 0.3% in 2017 and then to increase 2.0% in 2018. Energy-related
CO2 emissions are sensitive to changes in weather, economic growth, and energy prices.
U.S. Energy Information Administration | Short-Term Energy Outlook August 2017 3
Petroleum and natural gas markets review
Crude oil
Prices: Crude oil benchmark Brent front-month futures prices increased by $2.33 per barrel (b)
from July 3, settling at $52.01/b on August 3. The West Texas Intermediate (WTI) crude oil price
increased by $1.96/b during the same period, settling at $49.03/b (Figure 1). Brent and WTI
monthly average spot prices in July were $2.11/b and $1.45/b higher, respectively, than the
June averages.
Crude oil prices increased in response to supply-side factors as well as strong U.S. refinery
demand. Total commercial crude oil and petroleum product inventories in the United States fell
by 22.4 million barrels from June 30 to July 28, compared with a five-year average inventory
build of 5.9 million barrels over that period. Also, drilling activity in the United States, as
measured by the Baker Hughes active oil rig count, increased by 10 rigs in July, the fewest
monthly oil rig additions since the rig count began increasing in June 2016. Some U.S.
exploration and production companies recently announced less investment spending for the
rest of the year, suggesting the current rate of U.S. oil production growth could slow. EIA
forecasts that month-over-month crude oil production increases for the Lower 48 states
onshore region will slow to an average of 60,000 barrels per day (b/d) in the second half of
2017, compared with estimated average monthly growth of 110,000 b/d in the first half of the
year.
Crude oil prices were further supported as the Organization of the Petroleum Exporting
Countries (OPEC) member Saudi Arabia announced a cap on the country’s crude oil exports in
August. However, it is unclear how much extra crude oil this cap would remove from the market
given the country’s typical seasonal decline in crude oil exports because of an increase in crude
oil use for power generation. However, Libya and Nigeria, two other OPEC members, continue
to increase crude oil production, a contributing factor in keeping prices near $50/b.
U.S. Energy Information Administration | Short-Term Energy Outlook August 2017 4
Global economic growth expectations remain supportive of liquid fuels demand growth. Secondquarter
Gross Domestic Product grew 2.6% at a seasonally adjusted annual rate in the United
States and grew 6.9% and 2.1% year-over-year in China and the Eurozone, respectively.
Furthermore, global inflation data remain below targets set by the major central banks, allowing
the continuation of generally accommodative monetary conditions. EIA forecasts global liquid
fuels consumption to grow by 1.4 million b/d in 2017 and by 1.6 million b/d in 2018.
Strong oil inventory draws have likely caused front-month futures prices to increase more than
prices for contracts for delivery further in the future. Contango (when near-term prices are
lower than longer-dated ones) narrowed significantly in the past month. The Brent and WTI 1st-
13th spread increased $1.78/b and $1.47/b, respectively, from July 3 to August 3, settling at -73
cents/b and -72 cents/b, respectively (Figure 2).
In July, total commercial petroleum inventories in the Organization for Economic Cooperation
and Development (OECD) countries are estimated to have declined by the most year-over-year
since April 2014. In the United States, commercial crude oil stocks fell to 481.9 million barrels on
the week ending July 28, which was 95.0 million barrels above the five-year average. In recent
weeks, U.S. crude oil inventories reached the closest to the five-year average since September
2015. U.S. refineries have been running at record highs this year, with crude oil inputs averaging
17.3 million b/d for the four weeks ending July 28, contributing to the inventory decline and the
flattening crude oil futures price curve.
Crude oil quality differentials: The OPEC and non-OPEC crude oil voluntary production cuts
resulted primarily in less medium, sour and heavy, sour crude oils on the global market. As a
result, over the past several months, the usual premium that light, sweet crude oils command
over medium and heavy crude oils has declined in many regions around the world. Prices for
Urals crude oil, a medium, sour crude oil produced in Russia and priced in the Mediterranean
region, have increased in July compared with prices for lighter crude oils (Figure 3). The average
monthly spread between the Brent front-month price and Urals spot price declined from
U.S. Energy Information Administration | Short-Term Energy Outlook August 2017 5
$2.63/b in May to $1.35/b in July. Similarly, the average monthly price spread between Azeri
Light, a light crude oil produced in Azerbaijan, and Urals declined from $3.05/b to $1.73/b over
the same period.
Trade press reports indicate that less crude oil is being exported from Saudi Arabia to Europe,
which may be supporting prices of crude oils like Urals, which are similar in quality to Saudi
Arabian crude oil. Less Urals crude oil exported into the European region may also be supporting
Urals prices, as one of the pipelines that transports Urals crude oil for export from the Baltic Sea
is being converted to transport diesel. At the same time, higher crude oil production in Libya,
Nigeria, and the United States is adding additional light, sweet crude oil into the market and
could be contributing to a narrower price spread between light and medium crude oils.
Market-derived probabilities: The December 2017 WTI futures contract averaged $49.90/b for
the five trading days ending August 3 and has a market-derived probability of exceeding $50/b
of 46% (Figure 4). This contract had a 31% market-derived probability of exceeding $50/b as of
July 3. Larger than expected inventory withdrawals and petroleum demand reported in the
Weekly Petroleum Status Report (WPSR) could have contributed to an increase in market
expectations of WTI prices ending the year above $50/b.
U.S. Energy Information Administration | Short-Term Energy Outlook August 2017 6
Petroleum products
Gasoline prices: The front-month futures price of reformulated blendstock for oxygenate
blending (RBOB, the petroleum component of gasoline used in many parts of the country) rose
by 10 cents per gallon (gal) from July 3, settling at $1.63/gal on August 3 (Figure 5). The RBOBBrent
crack spread (the difference between the price of RBOB and the price of Brent crude oil)
rose by 4 cents/gal over the same period, settling at 39 cents/gal.
The RBOB-Brent crack spread averaged 40 cents/gal in July, 12 cents/gal more than in July 2016.
In the STEO forecast, EIA estimates that U.S. gasoline consumption reached a record high of 9.7
million barrels per day (b/d) in July. This estimate is supported by WPSR data that show average
gasoline consumption for the four weeks ending July 28 was 9.8 million b/d. WPSR data also
show finished gasoline exports for the four weeks ending July 28 were 0.6 million b/d, which, if
confirmed in monthly data, would be a record high for July because of continued demand from
Mexico and South America, among others.
U.S. Energy Information Administration | Short-Term Energy Outlook August 2017 7
Regional gasoline prices: The price premium of New York Harbor gasoline over Gulf Coast
gasoline reached a seven-month high toward the end of July (Figure 6). The relative strength in
the New York market was in response to refinery outages that occurred during a period of low
gasoline imports and low receipts of gasoline from the U.S. Gulf Coast compared with typical
levels, which contributed to declining gasoline stocks in Petroleum Administration for Defense
District (PADD) 1 (U.S. East Coast). Some gasoline production on the U.S. East Coast may have
been curtailed because of operational issues at refineries in Philadelphia and Delaware City in
recent weeks. WPSR estimates of total gasoline imports into the U.S. East Coast for July were
close to or below the five-year low. Further, gasoline movements from the U.S. Gulf Coast to the
U.S. East Coast were reported to be lower than usual. In June, shipments of gasoline through the
Colonial pipeline, which runs from the U.S. Gulf Coast to New York Harbor, were reported to fall
below capacity for the first time in almost six years.
With refinery issues as well as lower imports and regional movements, total gasoline stocks in
PADD 1B, which includes the New York Harbor region, have been declining since April and are
close to the five-year average for July, according to the WPSR. In contrast, gasoline stocks on the
U.S. Gulf Coast reached a record high for the month of July. The higher price premium for New
York Harbor gasoline may begin to attract gasoline shipments into the region in the coming
weeks.
 이미지 확대보기
U.S. Energy Information Administration | Short-Term Energy Outlook August 2017 8
Ultra-low sulfur diesel prices: The ultra-low sulfur diesel (ULSD) futures price rose by 13
cents/gal from July 3, settling at $1.64/gal on August 3. The ULSD-Brent crack spread (the
difference between the price of ULSD and the price of Brent crude oil) rose by 7 cents/gal,
settling at 40 cents/gal (Figure 7). On August 2, the ULSD-Brent crack spread reached the highest
point since September 2015.
According to the WPSR, distillate consumption reached 4.2 million b/d in July. That level is closer
to the consumption levels seen during the peak U.S. home heating season in the winter months,
and if confirmed in the monthly data, it would be a record high for July. Continued increases in
U.S. industrial production, manufacturing activity, and freight shipments are likely contributing
to increased domestic consumption of distillate. In addition, the Petroleum Supply Monthly
shows that distillate exports reached a record high of 1.5 million b/d in May.
U.S. Energy Information Administration | Short-Term Energy Outlook August 2017 9
Natural Gas
Prices: The front-month natural gas futures contract for delivery at Henry Hub settled at $2.80
per million British thermal units (MMBtu) on August 3, a decrease of 15 cents/MMBtu from July
3 (Figure 8). Natural gas futures prices fell during the second half of July and the beginning of
August as weather models forecasted below-normal temperatures in much of the eastern half
of the country for the first half of August. The Henry Hub natural gas spot price averaged
$2.98/MMBtu in July, almost unchanged compared with the June average.
Regional markets: Natural gas production in the Marcellus and Utica shales has risen
substantially in recent years, often outpacing the growth of natural gas pipeline capacity. This
growth has pushed regional natural gas prices lower relative to the benchmark Henry Hub price.
The front-month basis swap (the difference between a regional natural gas price and the price
at Henry Hub in Louisiana) for Dominion South in southeast Pennsylvania was -$1.20/MMBtu as
of August 3 (Figure 9), down from the average basis of -50 cents/MMBtu from January through
May 2017. This price decrease reflects constrained pipeline takeaway capacity, which drives
producers to lower their natural gas prices. Prior increases in takeaway capacity in the region
have narrowed the basis. In November 2016, the Algonquin Incremental Market (AIM)
expansion began service, and it likely contributed to the basis swap narrowing by more than
$1.00/MMBtu. The Dominion South basis swap could remain near -$1.00/MMBtu without new
takeaway capacity. However, the Federal Energy Regulatory Commission certified several new
natural gas pipeline projects for the region earlier this year. Once new capacity comes on line,
especially from the Atlantic Sunrise and Rover pipeline projects, the basis swap with Henry Hub
could narrow.
U.S. Energy Information Administration | Short-Term Energy Outlook August 2017 10
 이미지 확대보기
김대호 기자 yoonsk828@g-enews.com


![[초점] '무광고 원칙' 테슬라, 머스크 개인회사 X에 광고 집행 논...](https://nimage.g-enews.com/phpwas/restmb_setimgmake.php?w=80&h=60&m=1&simg=20240418101518015049a1f3094311109215171.jpg)