


이는 2014년의 2,8%에 비해 상당수준 호전되는 것이다.
2015년의 3.3%와 2015년의 4.0%는 2012년부터 2014년 까지 3년 평균 증가율 2.4%와 비교할 때 크게 높아지는 것이다.
예전의 높은 증가율에는 미치지 못하지만 깊은 침체에서는 일단 벗어나는 것으로 볼 수 있다.
최근의 세계 경기침체 중 상당 부분이 무역 침체에서 야기된 사실을 감안할 때 이 같은 무역경기의 회복은 세계 경제 활성화에도 큰 도움이 될 것으로 기대된다.
로베르토 아제베도 WTO 사무총장은 "세계 무역이 침체에서 벗어나 회복국면에 진입하고있다"면서 “보호무역 장벽들을 철회하고 시장접근을 촉진하며 지구촌 무역규제를 개혁함으로써 모든 사람에게 더 많은 기회를 제공하면서 무역을 증진시킬 수 있을 것”이라고 말했다.
세계무역기구 (WTO) 세계무역 전망보고서 전문
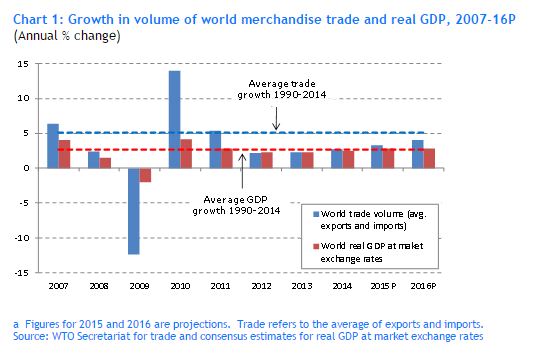
Growth in the volume of world merchandise trade will pick up only slightly over the next two years, rising from 2.8% in 2014 to 3.3% in 2015 and eventually to 4.0% in 2016, WTO economists announced 14 April.
Director-General Roberto Azevedo said that “by withdrawing protectionist measures, improving market access, avoiding policies which distort competition and striving to agree reforms to global trade rules, governments can boost trade and seize the opportunities that it offers for everyone.”
World merchandise trade is forecast to grow 3.3% in 2015 in volume terms as output picks up slightly in both developed and developing countries. Trade growth should accelerate to 4.0% in 2016, still below the average of 5.1% since 1990, and well below the pre-crisis average of 6.0%.
Trade volume growth has been very slow in recent years, measuring 2.8% in 2014 and averaging 2.4% over the last three years.
Exports of developing countries grew faster than those of developed countries in 2014, 3.3% vs. 2.2%.
Meanwhile, imports of developing countries grew more slowly, 2.0% compared with 3.2%.
The 50% drop in oil prices since July should boost incomes and imports in energy intensive economies (including developed countries and China) while reducing them in fuel exporters.
Numerous downside risks to the forecast exist including geopolitical tensions, divergent monetary policies, exchange rate fluctuations and slower growth in emerging economies.
Growth in the volume of world merchandise trade will pick up only slightly over the next two years, rising from 2.8% in 2014 to 3.3% in 2015 and eventually to 4.0% in 2016, WTO economists announced today.
Trade expansion will therefore remain well below the annual average of 5.1% posted since 1990.
The modest gains in 2014, marked the third consecutive year in which trade grew less than 3%. Trade growth averaged just 2.4% between 2012 and 2014, the slowest rate on record for a three year period when trade was expanding (i.e. excluding years like 1975 and 2009 when world trade actually declined).
Director-General Roberto Azevedo said:
“Trade growth has been disappointing in recent years, due largely to prolonged sluggish growth in GDP following the financial crisis. Looking forward we expect trade to continue its slow recovery but with economic growth still fragile and continued geopolitical tensions, this trend could easily be undermined.
“But we are not powerless in the face of this gloomy picture. Trade can be a powerful policy tool to leverage economic growth and development. By withdrawing protectionist measures, improving market access, avoiding policies which distort competition and striving to agree reforms to global trade rules, governments can boost trade and seize the opportunities that it offers for everyone.”
In the short-term at least, trade expansion will no longer far outstrip overall economic growth as had been the general pattern for decades. The 2.8% rise in world trade in 2014 barely exceeded the increase in world GDP for the year, and forecasts for trade growth in 2015 and 2016 only surpass expected output growth by a small margin.
 이미지 확대보기
Several factors contributed to the sluggishness of trade and output in 2014 and at the start of 2015, including slowing GDP growth in emerging economies, an uneven recovery in developed countries, and rising geopolitical tensions, among others. Strong exchange rate fluctuations, including a 14% appreciation of the US dollar against other currencies between July and March, have further complicated the trade situation and outlook.
Collapsing world oil prices in 2014 (down 47% between 15 July and 31 December) and weakness in other commodity classes hit export receipts and reduced import demand in exporting countries, but also boosted real incomes and imports in importing countries. Prices have continued to fall since then, suggesting excess supply, insufficient demand, or both. Whether this turns out to be a positive or a negative development on balance for world trade in 2015 remains to be seen.
The preliminary estimate of 2.8% for world trade growth in 2014 refers to the average of merchandise exports and imports in volume terms, i.e. adjusted to account for differences in inflation and exchange rates across countries. This figure is close to our most recent forecast of 3.1% from last September but below the 4.7% rise predicted at this time last year. A number of factors contributed to our initial overestimate, most of which could not have been anticipated.
The sharp declines in commodity prices since last July were not foreseen and did not figure in last year's estimates. The oil price drop was driven by surging production in North America, but falling demand in emerging markets also played a part, as it did with other commodities.
One year ago, economic forecasters were predicting above trend GDP growth in the United States and near trend growth in the euro area in 2014. Both predictions promised to support stronger trade growth but neither materialized, as a mix of strong and weak quarterly results in the United States only produced average growth for the year, while activity in the euro area was consistently mediocre.
Geopolitical tensions and natural phenomena also weighed on trade growth last year. The crisis in the Ukraine persisted throughout the year, straining trade relations between Russia on the one hand and the United States and European Union on the other. Conflict in the Middle East also stoked regional instability, as did an outbreak of Ebola haemorrhagic fever in West Africa. Finally, declines in first quarter trade and output in the United States were attributed to unusually harsh winter weather.
The WTO's trade forecasts depend on GDP projections from other organizations, but these have been consistently overstated since the financial crisis of 2008-09, biasing our trade forecasts upward.
Recent surveys of business sentiment and activity point to a firming of the economic recovery in the European Union, moderating growth in the United States, and subdued activity in some emerging economies, particularly Brazil and Russia. These indicators are consistent with the current trade forecast, but WTO economists cautioned that the presence of several risk factors added to the uncertainty of their estimates.
The most prominent risk is the divergence of monetary policies in the United States and the euro zone, as the Federal Reserve contemplates raising interest rates later this year while the European Central Bank has just started its own programme of quantitative easing. Others include a re-flaring of the debt crisis in the euro area, and a stronger-than-expected slowdown in emerging markets (particularly in resource exporting regions such as Africa, the Middle East, the Commonwealth of Independent States (CIS) and South America).
Finally, the rough two-to-one relationship that prevailed for many years between world trade growth and world GDP growth appears to have broken down, as illustrated by the fact that trade and output have grown at around the same rate for the last three years. This changing relationship has made trade forecasting particularly difficult in recent years and will continue to cloud the outlook for 2015 and 2016.
 이미지 확대보기
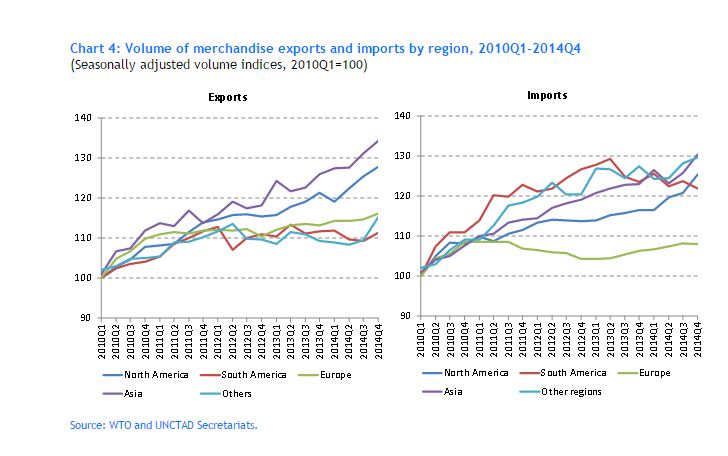
Annual data on merchandise and commercial services trade in current US dollar terms are presented in Appendix Tables 1 to 6. The dollar value of world merchandise trade stagnated in 2014, as exports rose just 0.7% to $18.95 trillion. This growth rate is lower than the one for merchandise trade in volume terms mentioned above (2.8% for the average of exports and imports), reflecting falling export and import prices from one year to the next, particularly for primary commodities.
By comparison, growth in the dollar value of world commercial services exports was stronger, increasing by 4% in 2014 to $4.85 trillion. It should be noted that the commercial services values are compiled using a new services classification in the balance of payments. Thus, figures are not directly comparable to those from earlier years. Comprehensive annual, quarterly and monthly data on merchandise and commercial services trade can be downloaded from the WTO's website.
One striking feature of the merchandise trade values in 2014 is the weakness of trade flows in natural resource exporting regions. The dollar value of exports from South America, the CIS, Africa and the Middle East fell 6%, 5.9%, 7.6% and 3.9%, respectively, as lower commodity prices cut in to export revenues. A sharp drop in imports of South America (‑4.2%) reflected recessionary conditions in leading regional economies, while an even steeper decline in CIS imports (‑11.2%) stemmed from a combination of factors, including falling oil prices and regional conflict.
For broad country aggregates and regions that do not export natural resources predominantly, trade statistics in volume terms may provide a clearer picture of trade developments. The WTO and UNCTAD jointly produce a variety of short-term trade statistics, including seasonally-adjusted quarterly merchandise trade volume indices. These are shown in Chart 2 by level of development.
World exports in volume terms only increased by 1.9% in the first half of 2014 compared to the same period in 2013, but year-on-year growth in the second half rose to 3.7%. Exports of developed and developing/emerging economies were both slow in the first half (1.8% and 2.1%, respectively) but shipments from developing/emerging countries grew faster in the second half (2.5% for developed, 5.1% for developing).
Weak import demand in the European Union has weighed heavily on world trade in recent years due to the large share of the EU in world imports (32% in 2014 including trade between EU member countries, 15% excluding it). Quarterly EU trade volume developments are shown in Chart 3.
Extra-EU exports in volume terms were flat for most of 2014 as demand in trading partners faltered. Meanwhile, EU imports staged a partial recovery as total imports (i.e. intra plus extra) rose 1.9% over the previous year. However, imports stalled toward the end of the year, dropping 0.4% in the 4th quarter. A stronger economic recovery in Europe may be necessary before the world can expect to see higher rates of trade growth.
Regional trade developments in volume terms are shown in Chart 4. Asia and North America had the fastest export growth in 2014. Shipments from South America and Other regions (i.e. Africa, Middle East and CIS) were mostly flat, but this is to be expected since traded quantities of oil and other natural resources tend to be insensitive to price changes. European exports grew more slowly, held back by weak import demand in the region.
North American imports in volume terms grew steadily in 2014, as did Asian imports following a setback in the second quarter. Imports of Other regions (i.e. Africa, Middle East, CIS) also grew in the second half of the year despite falling commodity prices, but South America's imports continued to trend downward after peaking in the second quarter of 2013. Finally, European imports remained depressed, having only recently regained their level of 2011Q3.
Monthly merchandise trade statistics in current dollar terms are more timely than quarterly statistics in volume terms, and are available for a larger number of countries. These are shown in Appendix Chart 1 through January or February, depending on availability.
Trade flows in dollar terms appear to have turned down sharply in many countries in the opening months of 2015. For example, extra-EU exports in dollar terms were down around 17% year-on-year in January, hitting their lowest level since April 2010, while imports were down by a similar amount. However, the extent of this decline may be exaggerated by dollar appreciation, which undervalues trade denominated in other currencies, and by the fall in oil prices, which reduces the dollar value of a given quantity of oil imports. By comparison, if trade values are expressed in euros, extra-EU exports were only down 2.5% in January. Exchange rates and oil prices may not explain all of the recent downturn, in which case trade may have indeed entered a soft patch in the first quarter of 2015. However, they do highlight the need to interpret dollar-denominated trade values very carefully in light of recent price changes.
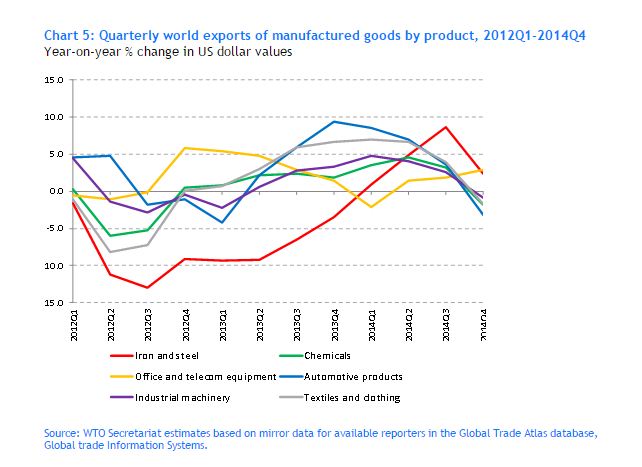
It shows estimated year-on-year growth in the dollar value of world trade in selected categories of manufactured goods. By the fourth quarter of 2014, trade in Iron and Steel had risen 2.4% compared with the same quarter in 2013 while shipments of Office and Telecom Equipment were up 3%. However, year-on-year growth in the dollar value of trade in other manufactured goods turned negative in Q4, with declines of between 1% and 3%. Since the financial crisis of 2008-09, trade in automotive products has tended to be a leading indicator of world trade while Iron and steel trade has been a lagging indicator. With demand for automobiles turning down, steel exporters like China may face reduced demand for the products overseas. Like the appendix charts in value terms, this chart should be interpreted with caution since the data are equally sensitive to fluctuations in prices and exchange rates.
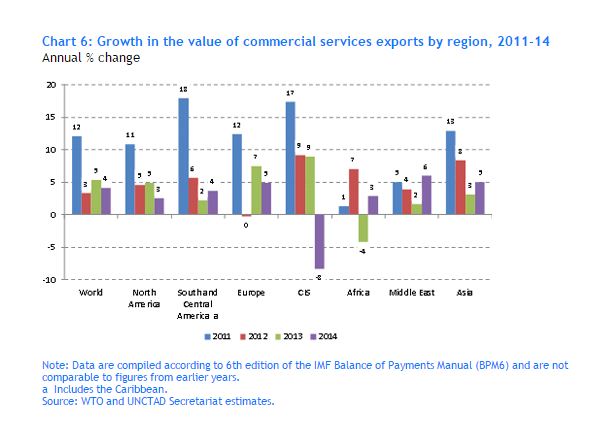
Finally, Chart 6 below provides a breakdown of commercial services exports by WTO geographic region. All regions saw modest increases in services exports of between 1% and 6% in 2014 except the Commonwealth of Independent States (CIS), which registered a strong decline of 8% that included drops in Transport Services (-3%), Travel (-12%) and Other Commercial Services (-5%). Imports are not shown in Chart 6, but the story is similar, with all regions recording modest increases except the CIS, which declined by 4%.
At the global level, the weakest component of services trade in 2014 was Manufacturing services on physical inputs owned by others(1), which was down 3% as measured by exports. Meanwhile, exports of Other commercial services, which includes Financial services and accounts for more than half (52%) of world commercial services trade, rose 5% last year.
OUTLOOK FOR TRADE IN 2015 and 2016
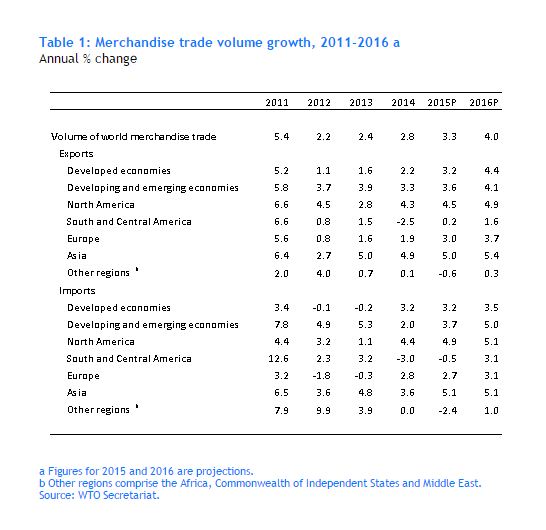
The WTO's forecasts of 3.3% growth in the volume of world merchandise trade for 2015 and 4.0% growth for 2016 are premised on consensus estimates of world real GDP at market exchange rates from other agencies (Table 1). These figures imply multiples of trade growth over GDP growth slightly greater than 1 in 2015 and 2016, higher than the rough 1-to-1 ratios for 2012-14 but still well below the 2-to-1 ratios that were common not so long ago.
Exports of developing/emerging economies are forecast to grow 3.6% in 2015, while their imports are expected to increase by 3.7%. Meanwhile, a 3.2% rise is anticipated for developed economies on both the export and import sides.
Asia should have the strongest export performance of any region this year (5.0%), followed closely by North America (4.5%). Europe's exports will also improve, with shipments rising 3.0% in 2015, up from 1.9% last year. The weakest export growth in 2015 will be in South America (0.2%) and Other regions (-0.6%, comprising Africa, Middle East and CIS), although small changes in export volumes from year to year are normal for resource-rich regions.
North America and Asia should both see imports increase by around 5% in 2015, while Europe records import growth of less than 3%. In contrast to this improvement, South America and Other regions are expected to record declines of 0.5% and 2.4%, respectively.
 이미지 확대보기
Risks to the trade forecasts are mostly on the downside. One such risk is the unbalanced nature of the global economic recovery. After an unexpected drop in its output in the 1st quarter of 2014, the United States saw its GDP accelerate and its unemployment rate fall in the remainder of the year, which in turn lifted US imports. Continued strength in the US economy would buttress global demand and reinforce the trade recovery. Conversely, any shortfall in the US performance would leave few alternative sources of rising import demand. US GDP growth could disappoint if tighter monetary conditions and lower oil prices choke off investment, including in the energy sector.
Economic conditions in the European Union are improving, but EU-wide unemployment remains high (9.8% in February) and contentious bailout negotiations between Greece and the rest of the euro area threaten to revive financial instability.
The outlook for China is also less certain than before, as activity in the world's largest economy (measured at purchasing power parity) has eased. The 7.4% increase in Chinese GDP in 2014 was the smallest such rise in 24 years, and Chinese officials have downgraded their output targets going forward. China's growth is still likely to exceed that of other major economies this year and next, but it may do so by a smaller margin than in the past. This suggests steady rather than accelerating import demand in China.
Lower prices for oil and other primary commodities provide some upside potential to the forecast if their positive impact on net importers of these products outweighs their negative impact on net exporters. The extent of the recent slide in commodity prices is illustrated by Chart 7. World trade could also grow faster than expected if a stronger economic recovery takes hold in the euro zone as a result of the European Central Bank's recently announced programme of monetary easing. Any recovery in demand in the European Union would have a disproportionate impact on world trade statistics due to the fact that trade between EU members is counted in global totals.
Much attention has been paid to the fact that the rough two-to-one relationship that prevailed for many years between world trade growth and world GDP growth appears to have broken down, as illustrated by the fact that trade and output have grown at around the same rate for the last three years (Chart 1). A number of explanations have been offered for the slower rate of increase recently, including adverse macroeconomic conditions, the maturation of global supply chains, and the accumulation of post-crisis protectionist measures, among others.
No definitive explanation has emerged, but some stylized facts can at least be discerned. First, the ratio of world trade growth to world GDP growth (referred to as the “income elasticity of world trade” by economists) peaked sometime in the 1990s, long before the financial crisis, but has fallen since then (Chart 8). Second, it is normal for world trade to grow slowly for a time after a global economic shock before faster growth resumes (e.g. the oil crises of the 1970s and early 1980s). Finally, a smaller global trade elasticity does not imply a lower world trade/GDP ratio, which remains at or near record levels.
These facts suggest a combination of cyclical and structural factors at work behind the trade slowdown. So while the WTO foresees continued slow trade growth in 2015 and 2016, it does not rule out a return to faster trade growth at a later date.
김대호 경제연구소 소장 tiger8280@