


;)
;)


연준 FOMC 자이언트스텝 금리인상 속도조절
 이미지 확대보기
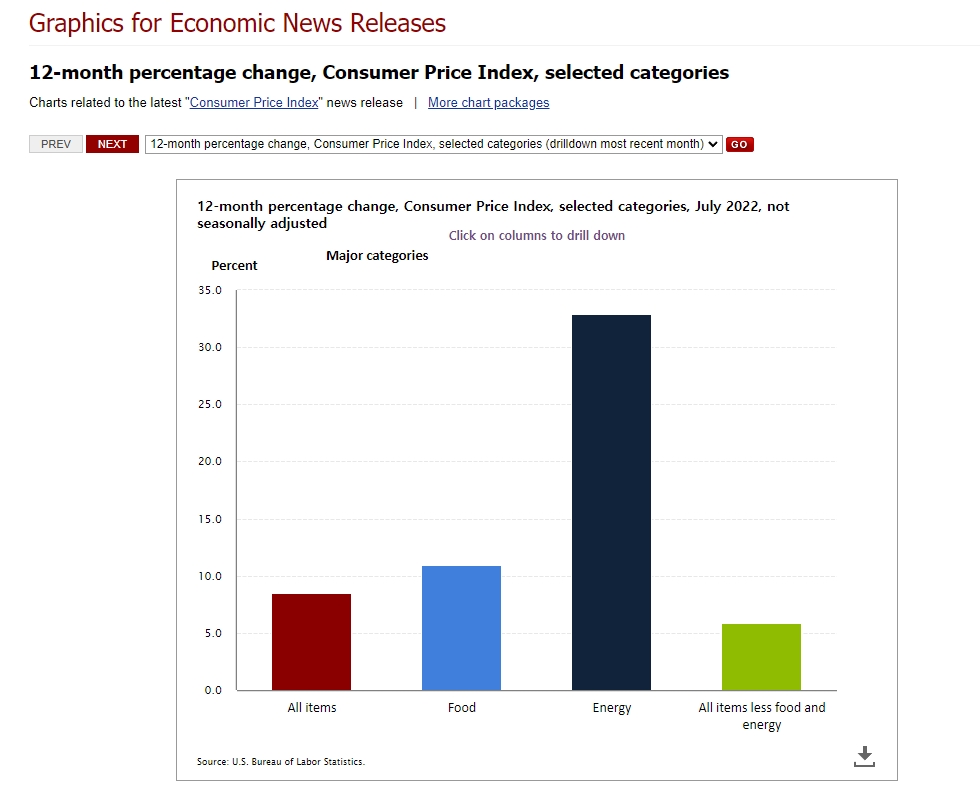
미국 노동부는 10일 밤 CPI를 공식 발표했다. 노동부가 발표한 7월 미국의 소비자물가지수 상승률은 8.5%이다. F전년 동기대비 8.5%는 지난 달 9.1%보다 무려 0.6% 포인트 낮아진 것이다. 미국 물가의 피;크아숙 곧 정점 통과가 사실로 드러났다. 물가의 정점통과는 뉴욕증시 비트코인에 호재이다. 미국 뉴욕증시에서는 연준 FOMC 자이언트스텝 금리인상 속도조절에 나설 것이라는 기대가 나오고 있다. 근원 CPI도 전년 동기 대비 하락했다. 다만 전월대비로는 전혀 변화가 없었다.
미국 CPI는 연준이 9월 공개시장위원회(FOMC) 회의에서 얼마나 금리를 인상할지를 예상할 수 있게 해 준다는 점에서 전 세계의 주목을 받아왔다.
다음은 미국 노동부 7월 CPI 보도자료
Consumer Price Index Summary
Transmission of material in this release is embargoed until
8:30 a.m. (ET) August 10, 2022 USDL-22-1625
Technical information: (202) 691-7000 * cpi_info@bls.gov * www.bls.gov/cpi
Media Contact: (202) 691-5902 * PressOffice@bls.gov
CONSUMER PRICE INDEX - JULY 2022
The Consumer Price Index for All Urban Consumers (CPI-U) was unchanged in July on a seasonally
adjusted basis after rising 1.3 percent in June, the U.S. Bureau of Labor Statistics reported today.
Over the last 12 months, the all items index increased 8.5 percent before seasonal adjustment.
The gasoline index fell 7.7 percent in July and offset increases in the food and shelter indexes,
resulting in the all items index being unchanged over the month. The energy index fell 4.6 percent
over the month as the indexes for gasoline and natural gas declined, but the index for electricity
increased. The food index continued to rise, increasing 1.1 percent over the month as the food at
home index rose 1.3 percent.
The index for all items less food and energy rose 0.3 percent in July, a smaller increase than in
April, May, or June. The indexes for shelter, medical care, motor vehicle insurance, household
furnishings and operations, new vehicles, and recreation were among those that increased over the
month. There were some indexes that declined in July, including those for airline fares, used cars
and trucks, communication, and apparel.
The all items index increased 8.5 percent for the 12 months ending July, a smaller figure than the
9.1-percent increase for the period ending June. The all items less food and energy index rose 5.9
percent over the last 12 months. The energy index increased 32.9 percent for the 12 months ending
July, a smaller increase than the 41.6-percent increase for the period ending June. The food index
increased 10.9 percent over the last year, the largest 12-month increase since the period ending
The food index increased 1.1 percent in July; this was the seventh consecutive monthly increase of
0.9 percent or more. The food at home index rose 1.3 percent in July as all six major grocery store
food group indexes increased. The index for nonalcoholic beverages rose the most, increasing 2.3
percent as the index for coffee rose 3.5 percent. The index for other food at home rose 1.8 percent,
as did the index for cereals and bakery products. The index for dairy and related products
increased 1.7 percent over the month. The index for meats, poultry, fish, and eggs rose 0.5 percent
in July after declining in June. The index for fruits and vegetables also increased 0.5 percent
over the month.
The food away from home index rose 0.7 percent in July after rising 0.9 percent in June. The index
for limited service meals increased 0.8 percent and the index for full service meals increased 0.6
percent over the month.
The food at home index rose 13.1 percent over the last 12 months, the largest 12-month increase
since the period ending March 1979. The index for other food at home rose 15.8 percent and the
index for cereals and bakery products increased 15.0 percent over the year. The remaining major
grocery store food groups posted increases ranging from 9.3 percent (fruits and vegetables) to 14.9
percent (dairy and related products).
The index for food away from home rose 7.6 percent over the last year. The index for full service
meals rose 8.9 percent over the last 12 months, and the index for limited service meals rose 7.2
percent over the last year.
Energy
The energy index fell 4.6 percent in July after rising 7.5 percent in June. The gasoline index fell
7.7 percent over the month following an 11.2-percent increase in June. (Before seasonal adjustment,
gasoline prices fell 7.7 percent in July.) The index for natural gas declined in July after sharp
recent increases, falling 3.6 percent. However, the electricity index increased in July, rising 1.6
percent, its third consecutive monthly increase of at least 1.3 percent.
The energy index rose 32.9 percent over the past 12 months. The gasoline index increased 44.0
percent over the span and the fuel oil index rose 75.6 percent. The index for electricity rose 15.2
percent, the largest 12-month increase since the period ending February 2006. The index for natural
gas increased 30.5 percent over the last 12 months.
All items less food and energy
The index for all items less food and energy rose 0.3 percent in July after increasing 0.7 percent
in June. The shelter index continued to rise but did post a smaller increase than the prior month,
increasing 0.5 percent in July compared to 0.6 percent in June. The rent index rose 0.7 percent in
July and the owners' equivalent rent index rose 0.6 percent. The index for lodging away from home
continued to decline, falling 2.7 percent in July after a 2.8-percent decrease in June.
The medical care index rose 0.4 percent in July after rising 0.7 percent in June as major medical
care component indexes continued to increase. The index for hospital services increased 0.5 percent
over the month, while the indexes for physicians' services and for prescription drugs both
increased 0.3 percent in July.
The index for motor vehicle insurance continued to increase, rising 1.3 percent in July after
increasing 1.9 percent in June. The index for household furnishings and operations rose 0.6 percent
after increasing 0.4 percent in June. The new vehicles index also increased 0.6 percent in July,
and the recreation index rose 0.3 percent over the month. Other indexes that increased in July
include personal care (+0.4 percent), alcoholic beverages (+0.5 percent), tobacco (+0.3 percent),
and education (+0.1 percent).
The index for airline fares fell sharply in July, decreasing 7.8 percent. The index for used cars
and trucks also declined over the month, falling 0.4 percent after rising in May and June. The
communication index fell 0.4 percent in July, and the apparel index fell 0.1 percent after rising
the prior two months.
The index for all items less food and energy rose 5.9 percent over the past 12 months, the same
increase as the period ending June. The shelter index rose 5.7 percent over the last year,
accounting for about 40 percent of the total increase in all items less food and energy. Several
transportation indexes also rose notably over the last year, including new vehicles (+10.4 percent),
used cars and trucks (+6.6 percent), motor vehicle insurance (+7.4 percent), and airline fares
(+27.7 percent).
Not seasonally adjusted CPI measures
The Consumer Price Index for All Urban Consumers (CPI-U) increased 8.5 percent over the last 12
months to an index level of 296.276 (1982-84=100). For the month, the index was unchanged prior to
seasonal adjustment.
The Consumer Price Index for Urban Wage Earners and Clerical Workers (CPI-W) increased 9.1 percent
over the last 12 months to an index level of 292.219 (1982-84=100). For the month, the index
declined 0.1 percent prior to seasonal adjustment.
The Chained Consumer Price Index for All Urban Consumers (C-CPI-U) increased 8.0 percent over the
last 12 months. For the month, the index increased 0.1 percent on a not seasonally adjusted basis.
Please note that the indexes for the past 10 to 12 months are subject to revision.
앞서 뉴욕증시에서는 미국 소비자물가지수(CPI)의 상승률이 둔화했을 것이라는 전망이 나온바 있다. 뉴욕증시 FX스트리트에 따르면 9개 월가 대형은행들이 평균적으로 예상한 7월 CPI 상승률은 전년비 8.7%이다. 10일 노동부가 발표한 7월 CPI는 8.5%로 뉴욕증시 컨센서스보다 더 낮다. 미국의 CPI는 9.1%로 정점을 찍었다는 이야기다. 국제유가가 급락하는 등 글로벌 인플레이션의 주범인 에너지 가격이 하락하면서 미국 물가 상승도 피크아웃을 맞고 있다. 국제유가가 급락함에 따라 미국의 휘발유 평균 가격도 갤런당 4달러 이하로 내려왔다. 미국의 기대 인플레이션도 크게 하락했다. 뉴욕 연방은행 조사에 따르면 미국 소비자들은 인플레이션이 내년에 6.2%, 향후 3년 동안 연 3.2%의 속도로 진행될 것이라고 예상했다. 이는 6월 조사에서 기록했던 6.8%와 3.6%에서 하락한 것이다. 시장은 전반적으로 미국 CPI가 정점을 찍고 하락세에 접어들었다고 보고 있다. 물가의 정점통과에도 불구하고 활발한 고용과 임금 상승 등 다른 경제적 요인이 물가를 계속 압박하고 있다는 점을 감안할 때 연방준비제도(연준)의 금리 인상은 계속될 것으로 보인다. 그럼에도 금리인상의 속도 조절에는 다소 여유가 생겼다,
물가의 가장 큰 변수는 유가이다. 최근 국제유가는 러시아의 우크라이나 침공 이후 가장 낮은 수준을 보이고는 있지만 지정학적 이벤트와 글로벌 경제의 둔화 속도에 민감하게 움직일 수 있다. 미국 자동차협회(AAA)에 따르면 주유소 휘발유 가격은 6월 중순과 비교해 20% 떨어졌다. 가계에 가장 큰 부담으로 작용하는 휘발유 가격이 연일 하락하고 기대인플레이션도 꺾였다. 그렇다고 인플레이션에 대한 우려가 완전히 해소된 것으로 보기는 어렵다. 미국 내 휘발유 가격은 1년 전과 비교하면 여전히 60% 이상 뛴 상태다. 국제유가가 최근 배럴당 90달러를 밑돌며 우크라이나 전쟁 이전 수준으로 떨어졌으나 우크라이나 전쟁 등으로 여전히 공급이 빡빡한데다 재고량도 넉넉하지 않다. 석유수출국기구(OPEC) 및 러시아 등 비(非)OPEC 주요 23개 산유국 협의체인 ‘OPEC+’가 조 바이든 미 대통령의 사우디아라비아 방문에도 증산 의지를 보이지 않고 있다. OPEC+는 지난 3일 정례회의에서 9월 원유 증산량을 하루 10만배럴로 결정했다. 이는 7·8월 증산량(하루 64만8000배럴)의 15%에 불과하다.
미국 에너지 기업들은 신재생 에너지 전환에 집중하며 화석연료에 대한 신규 또는 추가 투자를 기피하고 있다. US 뱅크 웰스 매니지먼트의 롭 하워스 수석 투자전략가는 “러시아와 우크라이나의 갈등이 끝나지 않는 한 세계 경제는 지속적인 석유 부족에 직면해 있다. 공급이 빠듯하다”고 지적했다.
주택 가격 및 임대료 상승도 인플레이션 복병이다. 6월 미국의 기존 주택 가격은 41만 6000달러로 1년 전보다 13.4% 상승했다. 온라인 부동산 정보제공업체 리얼터닷컴에 따르면 중간값 기준 미 가계소득의 30%가 임대료로 쓰이고 있다. 또한 전체 소비자물가지수(CPI)의 약 3분의 1, 식료품·에너지를 제외한 근원 CPI의 약 40%가 주택 관련 지출이다. 그런만큼 아직 물가를 안심하기는 이르다.
김대호 글로벌이코노믹 연구소장 tiger8280@g-enews.com