


;)
;)


 이미지 확대보기
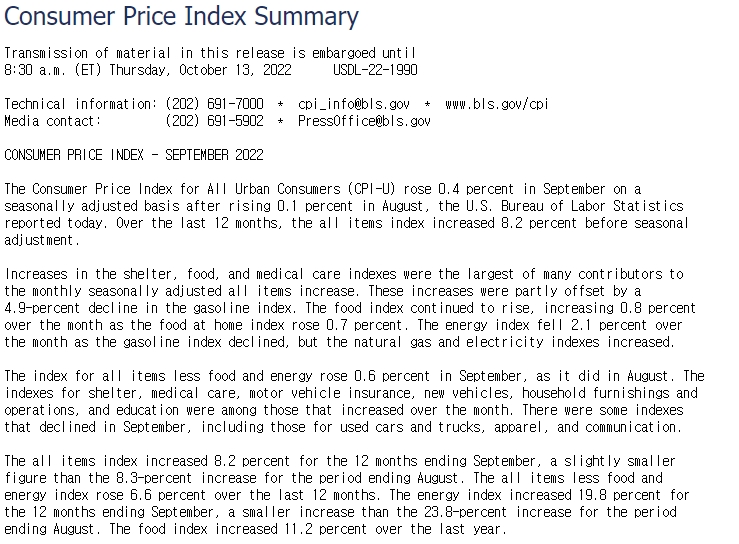
미국 노동부는 10일 지난 10월 미국의 소비자물가지수 CPI가 지난해 같은 기간보다 7.7% 올랐다고 발표했다.전월 대비 CPI는 0.4% 올랐다. 근원 CPI는 전년 대비 6.3%오르고 또 전월 대비 0 3% 상승했다. CPI가 전년 동월 대비 7%대로 내려온 것은 러시아의 우크라이나 침공 전인 2월 이후 8개월 만이다 미국의 인플레가 정점을 지나 마침내 하락 기조로 돌아서면서 FOMC 금리인상 속도조절 기대가 높아지고 뉴욕증시 비트코인는 "환호"하고 있다.
Consumer Price Index Summary
CONSUMER PRICE INDEX - OCTOBER 2022
The Consumer Price Index for All Urban Consumers (CPI-U) rose 0.4 percent in October on a
seasonally adjusted basis, the same increase as in September, the U.S. Bureau of Labor Statistics
reported today. Over the last 12 months, the all items index increased 7.7 percent before seasonal
adjustment.
The index for shelter contributed over half of the monthly all items increase, with the indexes for
gasoline and food also increasing. The energy index increased 1.8 percent over the month as the
gasoline index and the electricity index rose, but the natural gas index decreased. The food index
increased 0.6 percent over the month with the food at home index rising 0.4 percent.
The index for all items less food and energy rose 0.3 percent in October, after rising 0.6 percent
in September. The indexes for shelter, motor vehicle insurance, recreation, new vehicles, and
personal care were among those that increased over the month. Indexes which declined in October
included the used cars and trucks, medical care, apparel, and airline fares indexes.
미국의 대표 물가 지표인 CPI의 결과에 따라 미국 연준(Fed)의 기준금리 상승 폭이 결정된다는 점에서 금융시장에서는 오래전부터 비상한 관심을 가져왔다. 연준 페드 Fed가 12월 FOMC에서 자이언트 스텝 즉 한 번에 기준금리 75bp 인상을 할지 아니면 빅 스텝(한 번에 기준금리 50bp 인상)에 그칠지도 CPI 에 따라 판도가 결정된다고 할 수 있다. 특히 에너지와 식료품을 제외한 근원 CPI는 연준 금리 결정의 핵심 기준이 된다. 뉴욕증시 뿐 아니라 달러환율 국채금리 비트코인 디어리움 리플 등 가상화폐 그리고 국제유가도 CPI로 부터 큰 영향을 받게 된다.
미국 노동부의 발표에 앞서 뉴욕증시의 메이저 언론인 월 스트리트저널은 10월 미국 CPI가 지난해 같은 기간보다 7.9% 올랐을 것이라고 예측한 바 있다. 전월 대비 CPI는 0.6% 올랐을 것으로 예상됐다. 근원 CPI는 전년 대비 6.5% 오르고 또 전월 대비 0.5% 상승했을 것으로 전망됐다. CPI가 전년 동월 대비 7%대로 내려온 것은 러시아의 우크라이나 침공 전인 2월 이후 8개월 만이다. CPI는 2022년 2월 7.9%를 기록하며 1982년 1월의 8.4% 이후 최고치를 기록했다. 이후 미국 CPI는 8% 밑으로 내려오지 않았다. 최근 들어 미국 소비자 물가가 잡히고 있다는 신호가 조금씩 잡히기 시작했다. 미국의 대표 주택가격 지표인 ‘스탠더드 앤드 푸어스(S&P) 코어로직 케이스-실러 주택가격지수’는 8월 전달보다 1.1% 하락했다. 7월의 (-0.3%)에 이어 두 달 연속 하락이다. 존 윌리엄스 뉴욕 연방준비은행 총재는 최근 연설에서 "인플레이션 불확실성이 증가했지만, 장기 기대 인플레이션은 연준의 목표치와 일치하는 수준에서 상당히 안정적으로 유지되고 있다”고 말했다. 토마스 바킨 리치먼드 연은 총재도 “고물가의 막바지에 있다. 상품가격은 완화되고 있고 공급망 문제도 해결되고 있다”고 언급했다. 제롬 파월 Fed 의장은 지난 2일(현지시간) "금리인상 속도를 줄일 시기가 다가오고 있다”며 “이르면 다음 (FOMC) 회의가 될 수도, 아니면 그다음 회의가 될 수도 있다"고 말하기도 했다. 12월 자이언트 스텝이 아닌 빅 스텝 가능성도 시사한 것으로 풀이된다.
JP모간은 "미국의 인플레이션이 이미 정점에 도달했고, 내년 초까지 점진적으로 하락할 것"이라며 "투자자들이 증시에 진입하기 아주 좋은 시기가 찾아오고 있다"고 밝혀다. 데이비드 캘리(David Kelly) JP모간 수석 전략가는 한 인터뷰에서 미국 증시가 밸류에이션에 비해 지나치게 하락했음을 강조했다. 그는 이어 "올해 미국 연방준비제도(Fed·연준)가 인플레이션을 잡기 위해 고강도 긴축을 시행하는 과정에서 증시가 지나친 수준으로 하락했다"면서 "인플레이션 완화 신호가 나타나고 있는 만큼 증시도 낙폭을 회복할 수 있을 것"이라고 진단했다. 이어 "내일 발표되는 미국의 10월 CPI를 통해 인플레이션 정점론을 확인할 수 있을 것"이라며 "인플레이션이 꺾이고 있다는 가정하에 미국 증시의 장기 수익률이 약 8%로 전망된다"고 전했다.
JP모간은 그러면서도 지나친 증시 낙관론도 주의할 필요가 있다고 강조했다. 인플레이션 정점론이 증시 랠리를 촉발시킬 수 있지만 아직 미국의 중간선거 결과라는 대형 변수가 남아있기 때문이다. 이를 두고 캘리 전략가는 "공화당이 하원과 상원을 모두 장악하지 못할 경우 연말 상승 랠리가 제한될 수 있을 것"이라고 분석했다.
뉴욕증시 일각에서는 미국 중앙은행인 연방준비제도(Fed·연준)가 내년에 기준금리를 6%까지 올릴 수도 있다는 전망도 나오고 있다. 연준이 내년까지 이어질 것으로 예상되는 높은 인플레이션을 완화하기 위해 기준금리를 6%대로 올릴 가능성에 대비해야 한다는 목소리도 나왔다. 미국 연준은 올 3월부터 기준금리 인상을 시작해 0.25%였던 금리 상단을 4.0%로 끌어올렸다. 최근 4번의 연방공개시장위원회(FOMC)에서는 연속으로 ‘자이언트스텝’(한번에 기준금리 0.75%포인트 인상)을 밟으며 긴축의 고삐를 바짝 조였다. 미 기준금리가 4%대로 올라선 것은 2007년 12월 이후 15년 만이다. 뉴욕증시에서는 11월 FOMC 이후 최종금리 전망을 상향 조정했다. 당시 제롬 파월 연준 의장이 긴축 속도를 조절을 언급하면서도 최종 금리가 이전 예상보다 높아질 것이라고 말했기 때문이다. 연준 위원들이 당시 제시한 최종금리 수준은 4.50~4.75%로, 파월 의장의 발언 이후 최종금리 5% 돌파는 기정사실화됐다. 최종금리 6% 전망은 인플레이션이 연준이 원하는 만큼 빠르게 잡히지 않을 것이란 분석에 기인한다.
 이미지 확대보기
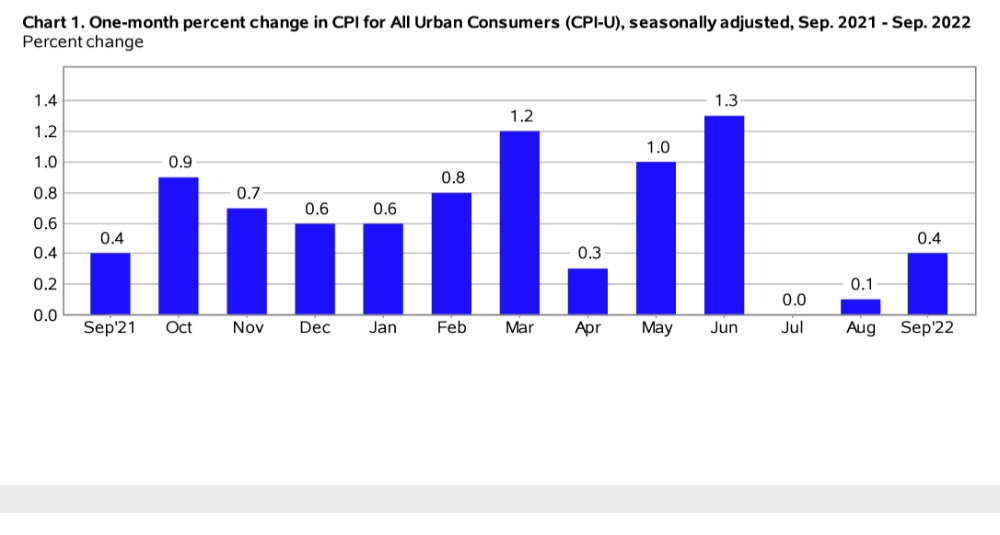
시카고상품거래소(CME) 페드워치에 따르면 12월 FOMC에서 기준금리가 0.5%포인트 인상될 가능성은 56.8%로 0.75%포인트 인상 가능성(43.2%)보다 높다. 이 예상대로 라면 올해 연말 미국 기준금리는 4.25~4.5%가 된다. CPI 에 이어 하루 후 나오는는 미시간대의 5년, 10년 기대 인플레이션도 주목대상이다. 리치몬드 연방준비은행(연은)의 토마스 바킨 총재는 "인플레이션이 정상 수준으로 느리게 복귀하면 기대 인플레의 안정성을 위협할 수 있다"고 경고했다. CPI가 예상에 부합해도 5년-10년 기대인플레가 2011년 이후 최고로 오르면 미국 국채수익률은 더 오를 수 있다는 것이다.
한국시간 10일 오전에 마감한 뉴욕증시는 미국의 중간선거 결과와 소비자물가지수(CPI) 발표 경계로 하락했다. 뉴욕 증권거래소(NYSE)에서 다우존스30산업평균지수와 스탠더드앤드푸어스(S&P)500지수 그리고 나스닥지수 모두 하락 마감했다.
뉴욕증권거래소(NYSE)에서 다우존스30산업평균지수는 전장보다 646.89포인트(1.95%) 하락한 32,513.94에 거래를 마감했다. 스탠더드앤드푸어스(S&P)500지수는 전일보다 79.54포인트(2.08%) 급락한 3,748.57을, 나스닥지수는 263.02포인트(2.48%) 급락한 10,353.18에 거래를 마쳤다. 중간선거 결과에 따른 일부 차익실현 매물이 유입된데다 10월 CPI에 대한 경계심이 지속된 탓이다.
미국의 증권 감독 당국인 증권거래위원회(SEC)가 최근 뱅크런(bank run, 대규모 예금 인출 사태)이 발생한 FTX에 대한 조사에 착수해 결국 FTX가 파산을 면치 못할 것이라고 월스트리트저널(WSJ)이 보도했다. SEC는 이날 FTX의 뱅크런 소식을 듣고 즉각 조사에 착수했다고 밝혔다. SEC는 이전에도 FTX에 대한 조사를 진행하고 있었으나 전일 뱅크런이 발생하자 전면적인 수사로 전환했다. SEC는 FTX가 SEC의 사전 승인을 받지 않고 암호화폐 관련 상품을 판매한 것을 집중적으로 조사하고 있다.
FTX의 인수를 발표했던 세계최대 암호화폐 거래업체 바이낸스도 SEC의 조사 등을 이유로 하루 만에 인수 취소를 발표했다. 가상화폐 시장은 대혼란에 빠졌다. 비트코인은 2020년 11월 이후 2년 만에 최저가를 기록했다. 비트코인 뿐 아니라 이더리움도 급락했다. 결국 FTX가 파산절차를 밟으면 여기에 투자한 뉴욕증시의 블랙록, 세콰이어, 온타리오 교사연금, 소프트뱅크그룹, 타이거 글로벌 매니지먼트, 테마섹 등 주요 펀드 및 연금들의 손실도 커질 수 있다.
미국 노동부 소비자물가지수 CPI 발표문
Consumer Price Index Summary
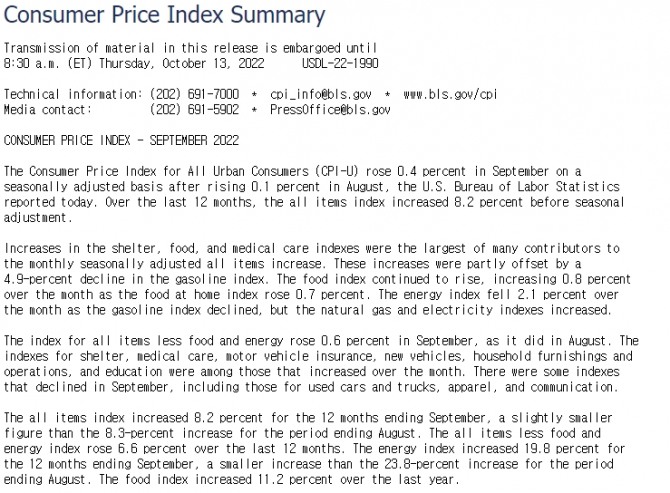
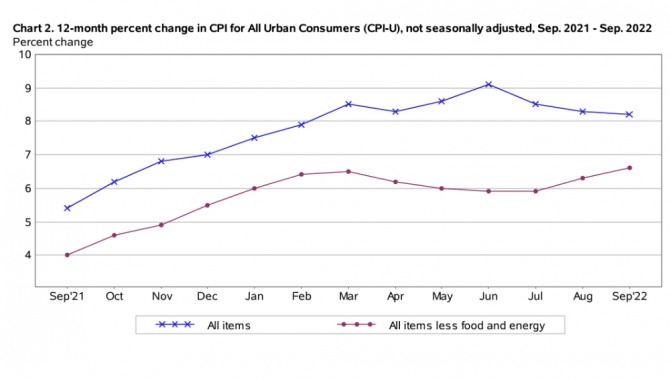
The Consumer Price Index for All Urban Consumers (CPI-U) rose 0.4 percent in September on a
seasonally adjusted basis after rising 0.1 percent in August, the U.S. Bureau of Labor Statistics
reported today. Over the last 12 months, the all items index increased 8.2 percent before seasonal
adjustment.
Increases in the shelter, food, and medical care indexes were the largest of many contributors to
the monthly seasonally adjusted all items increase. These increases were partly offset by a
4.9-percent decline in the gasoline index. The food index continued to rise, increasing 0.8 percent
over the month as the food at home index rose 0.7 percent. The energy index fell 2.1 percent over
the month as the gasoline index declined, but the natural gas and electricity indexes increased.
The index for all items less food and energy rose 0.6 percent in September, as it did in August. The
indexes for shelter, medical care, motor vehicle insurance, new vehicles, household furnishings and
operations, and education were among those that increased over the month. There were some indexes
that declined in September, including those for used cars and trucks, apparel, and communication.
The all items index increased 8.2 percent for the 12 months ending September, a slightly smaller
figure than the 8.3-percent increase for the period ending August. The all items less food and
energy index rose 6.6 percent over the last 12 months. The energy index increased 19.8 percent for
the 12 months ending September, a smaller increase than the 23.8-percent increase for the period
ending August. The food index increased 11.2 percent over the last year.
 이미지 확대보기
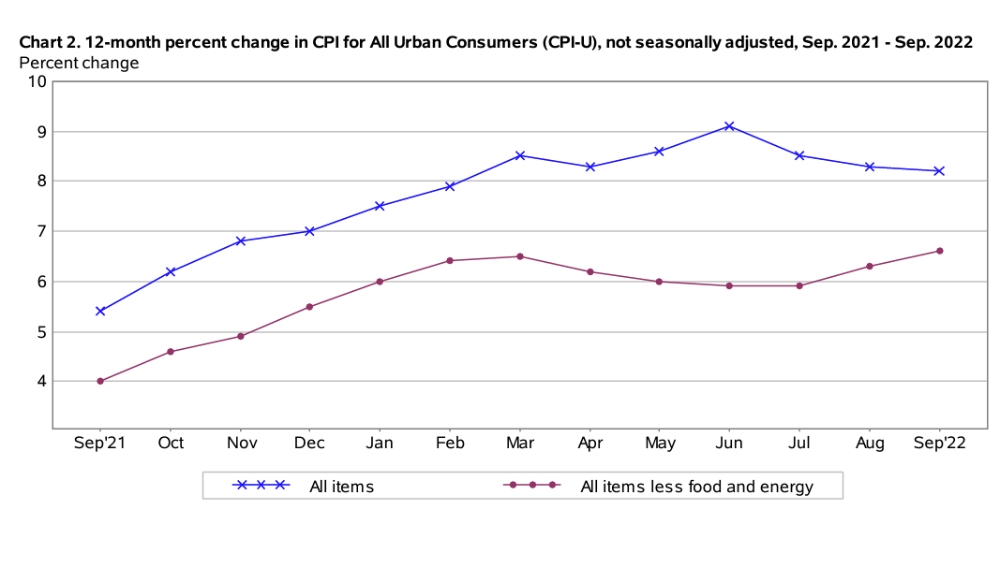
Food
The food index increased 0.8 percent in September, the same increase as August. The food at home
index rose 0.7 percent in September as all six major grocery store food group indexes increased. The
index for fruits and vegetables rose 1.6 percent, while the index for cereals and bakery products
rose 0.9 percent over the month. The index for other food at home increased 0.5 percent in September,
after rising 1.1 percent in August. The index for meats, poultry, fish, and eggs rose 0.4 percent
over the month while the index for nonalcoholic beverages increased 0.6 percent in September. The
dairy and related products index rose 0.3 percent in September, the same increase as the previous
month.
The food away from home index rose 0.9 percent in September, as it did in August. The index for full
service meals increased 0.4 percent and the index for limited service meals increased 0.6 percent
over the month. The food at employee sites and schools index rose 44.9 percent in September,
reflecting the expiration of some free school lunch programs.
The food at home index rose 13.0 percent over the last 12 months. The index for cereals and bakery
products increased 16.2 percent over the year and the index for dairy and related products rose 15.9
percent. The remaining major grocery store food groups posted increases ranging from 9.0 percent
(meats, poultry, fish, and eggs) to 15.7 percent (other food at home).
The index for food away from home rose 8.5 percent over the last year. The index for full service
meals rose 8.8 percent over the last 12 months, and the index for limited service meals rose 7.1
percent over the same period.
Energy
The energy index declined 2.1 percent in September after falling 5.0 percent in August. The gasoline
index fell 4.9 percent over the month following a 10.6-percent decrease in August. (Before seasonal
adjustment, gasoline prices fell 5.6 percent in September.) However, the index for natural gas
increased in September, rising 2.9 percent after increasing 3.5 percent in August. The electricity
index also increased over the month, rising 0.4 percent.
The energy index rose 19.8 percent over the past 12 months. The gasoline index increased 18.2
percent over the span and the fuel oil index rose 58.1 percent. The index for electricity rose 15.5
percent over the last 12 months, and the index for natural gas increased 33.1 percent over the same
period.
All items less food and energy
The index for all items less food and energy rose 0.6 percent in September, following an identical
increase in August. The shelter index continued to increase, rising 0.7 percent in September, also
the same as in August. The rent index rose 0.8 percent in September. The owners' equivalent rent
index also increased 0.8 percent over the month, the largest monthly increase in that index since
June 1990. The index for lodging away from home fell 1.0 percent over the month.
The medical care index rose 0.8 percent in September after rising 0.7 percent in August. The index
for physicians' services increased 0.5 percent over the month, while the index for hospital services
increased 0.1 percent. The index for prescription drugs fell 0.1 percent in September.
The index for motor vehicle insurance continued to rise, increasing 1.6 percent in September after
rising 1.3 percent in August. The new vehicles index increased 0.7 percent over the month, and the
household furnishings and operations index rose 0.5 percent in September. Other indexes that
increased in September include personal care (+0.4 percent), education (+0.4 percent), airline
fares (+0.8 percent), and recreation (+0.1 percent).
A few indexes declined over the month, including the index for used cars and trucks, which fell 1.1
percent in September after decreasing 0.1 percent in August. The apparel index fell 0.3 percent over
the month, and the communication index decreased 0.1 percent in September.
The index for all items less food and energy rose 6.6 percent over the past 12 months, the largest
12-month increase in that index since August 1982. The shelter index also rose 6.6 percent over the
last year, accounting for over 40 percent of the total increase in all items less food and energy.
Other indexes with notable increases over the last year include medical care (+6.0 percent),
household furnishings and operations (+9.3 percent), new vehicles (+9.4 percent), and used cars and
trucks (+7.2 percent).
Not seasonally adjusted CPI measures
The Consumer Price Index for All Urban Consumers (CPI-U) increased 8.2 percent over the last 12
months to an index level of 296.808 (1982-84=100). For the month, the index increased 0.2 percent
prior to seasonal adjustment.
The Consumer Price Index for Urban Wage Earners and Clerical Workers (CPI-W) increased 8.5 percent
over the last 12 months to an index level of 291.854 (1982-84=100). For the month, the index
increased 0.1 percent prior to seasonal adjustment.
The Chained Consumer Price Index for All Urban Consumers (C-CPI-U) increased 8.0 percent over the
last 12 months. For the month, the index increased 0.3 percent on a not seasonally adjusted basis.
Please note that the indexes for the past 10 to 12 months are subject to revision.
_______________
The Consumer Price Index for October 2022 is scheduled to be released on Thursday,
November 10, 2022, at 8:30 a.m. (ET).
--------------------------------------------------------------------------------------------
January 2023 Consumer Price Index Weight Update
Starting with January 2023 data, BLS plans to update weights annually for the Consumer
Price Index based on a single calendar year of data, using consumer expenditure data from
2021. This reflects a change from prior practice of updating weights biennially using two
years of expenditure data.
---------------------------------------------------------------------------------------------
Technical Note
Brief Explanation of the CPI
The Consumer Price Index (CPI) measures the change in prices paid by consumers for goods
and services. The CPI reflects spending patterns for each of two population groups: all
urban consumers and urban wage earners and clerical workers. The all urban consumer group
represents about 93 percent of the total U.S. population. It is based on the expenditures
of almost all residents of urban or metropolitan areas, including professionals, the self
-employed, the poor, the unemployed, and retired people, as well as urban wage earners
and clerical workers. Not included in the CPI are the spending patterns of people living
in rural nonmetropolitan areas, farming families, people in the Armed Forces, and those
in institutions, such as prisons and mental hospitals. Consumer inflation for all urban
consumers is measured by two indexes, namely, the Consumer Price Index for All Urban
Consumers (CPI-U) and the Chained Consumer Price Index for All Urban Consumers (C-CPI-U).
The Consumer Price Index for Urban Wage Earners and Clerical Workers (CPI-W) is based on
the expenditures of households included in the CPI-U definition that meet two requirements:
more than one-half of the household's income must come from clerical or wage occupations,
and at least one of the household's earners must have been employed for at least 37 weeks
during the previous 12 months. The CPI-W population represents about 29 percent of the
total U.S. population and is a subset of the CPI-U population.
The CPIs are based on prices of food, clothing, shelter, fuels, transportation, doctors'
and dentists' services, drugs, and other goods and services that people buy for day-to-day
living. Prices are collected each month in 75 urban areas across the country from about
6,000 housing units and approximately 22,000 retail establishments (department stores,
supermarkets, hospitals, filling stations, and other types of stores and service
establishments). All taxes directly associated with the purchase and use of items are
included in the index. Prices of fuels and a few other items are obtained every month in
all 75 locations. Prices of most other commodities and services are collected every month
in the three largest geographic areas and every other month in other areas. Prices of most
goods and services are obtained by personal visit, telephone call, or web collection by the
Bureau's trained representatives.
In calculating the index, price changes for the various items in each location are
aggregated using weights, which represent their importance in the spending of the
appropriate population group. Local data are then combined to obtain a U.S. city average.
For the CPI-U and CPI-W, separate indexes are also published by size of city, by region of
the country, for cross-classifications of regions and population-size classes, and for 23
selected local areas. Area indexes do not measure differences in the level of prices among
cities; they only measure the average change in prices for each area since the base period.
For the C-CPI-U, data are issued only at the national level. The CPI-U and CPI-W are
considered final when released, but the C-CPI-U is issued in preliminary form and subject
to three subsequent quarterly revisions.
The index measures price change from a designed reference date. For most of the CPI-U and
the CPI-W, the reference base is 1982-84 equals 100. The reference base for the C-CPI-U is
December 1999 equals 100. An increase of 7 percent from the reference base, for example,
is shown as 107.000. Alternatively, that relationship can also be expressed as the price
of a base period market basket of goods and services rising from $100 to $107.
Sampling Error in the CPI
The CPI is a statistical estimate that is subject to sampling error because it is based
upon a sample of retail prices and not the complete universe of all prices. BLS calculates
and publishes estimates of the 1-month, 2-month, 6-month, and 12-month percent change
standard errors annually for the CPI-U. These standard error estimates can be used to
construct confidence intervals for hypothesis testing. For example, the estimated standard
error of the 1-month percent change is 0.03 percent for the U.S. all items CPI. This means
that if we repeatedly sample from the universe of all retail prices using the same
methodology, and estimate a percentage change for each sample, then 95 percent of these
estimates will be within 0.06 percent of the 1-month percentage change based on all retail
prices. For example, for a 1-month change of 0.2 percent in the all items CPI-U, we are 95
percent confident that the actual percent change based on all retail prices would fall
between 0.14 and 0.26 percent. For the latest data, including information on how to use
the estimates of standard error, see www.bls.gov/cpi/tables/variance-estimates/home.htm.
Calculating Index Changes
Movements of the indexes from 1 month to another are usually expressed as percent changes
rather than changes in index points, because index point changes are affected by the level
of the index in relation to its base period, while percent changes are not. The following
table shows an example of using index values to calculate percent changes:
Item A Item B Item C
Year I 112.500 225.000 110.000
Year II 121.500 243.000 128.000
Change in index points 9.000 18.000 18.000
Percent change 9.0/112.500 x 100 = 8.0 18.0/225.000 x 100 = 8.0 18.0/110.000 x 100 = 16.4
Use of Seasonally Adjusted and Unadjusted Data
The Consumer Price Index (CPI) produces both unadjusted and seasonally adjusted data.
Seasonally adjusted data are computed using seasonal factors derived by the X-13ARIMA-SEATS
seasonal adjustment method. These factors are updated each February, and the new factors are
used to revise the previous 5 years of seasonally adjusted data. The factors are available
at www.bls.gov/cpi/tables/seasonal-adjustment/seasonal-factors-2022.xlsx. For more
information on data revision scheduling, please see the Factsheet on Seasonal Adjustment at
www.bls.gov/cpi/seasonal-adjustment/questions-and-answers.htm and the Timeline of Seasonal
Adjustment Methodological Changes at
www.bls.gov/cpi/seasonal-adjustment/timeline-seasonal-adjustment-methodology-changes.htm.
For analyzing short-term price trends in the economy, seasonally adjusted changes are usually
preferred since they eliminate the effect of changes that normally occur at the same time and
in about the same magnitude every year-such as price movements resulting from weather events,
production cycles, model changeovers, holidays, and sales. This allows data users to focus on
changes that are not typical for the time of year. The unadjusted data are of primary interest
to consumers concerned about the prices they actually pay. Unadjusted data are also used
extensively for escalation purposes. Many collective bargaining contract agreements and pension
plans, for example, tie compensation changes to the Consumer Price Index before adjustment for
seasonal variation. BLS advises against the use of seasonally adjusted data in escalation
agreements because seasonally adjusted series are revised annually.
Intervention Analysis
The Bureau of Labor Statistics uses intervention analysis seasonal adjustment (IASA) for some
CPI series. Sometimes extreme values or sharp movements can distort the underlying seasonal
pattern of price change. Intervention analysis seasonal adjustment is a process by which the
distortions caused by such unusual events are estimated and removed from the data prior to
calculation of seasonal factors. The resulting seasonal factors, which more accurately represent
the seasonal pattern, are then applied to the unadjusted data.
For example, this procedure was used for the motor fuel series to offset the effects of the 2009
return to normal pricing after the worldwide economic downturn in 2008. Retaining this outlier
data during seasonal factor calculation would distort the computation of the seasonal portion
of the time series data for motor fuel, so it was estimated and removed from the data prior to
seasonal adjustment. Following that, seasonal factors were calculated based on this "prior
adjusted" data. These seasonal factors represent a clearer picture of the seasonal pattern in
the data. The last step is for motor fuel seasonal factors to be applied to the unadjusted data.
For the seasonal factors introduced for January 2022, BLS adjusted 72 series using intervention
analysis seasonal adjustment, including selected food and beverage items, motor fuels, electricity,
and vehicles.
Revision of Seasonally Adjusted Indexes
Seasonally adjusted data, including the U.S. city average all items index levels, are subject to
revision for up to 5 years after their original release. Every year, economists in the CPI
calculate new seasonal factors for seasonally adjusted series and apply them to the last 5 years
of data. Seasonally adjusted indexes beyond the last 5 years of data are considered to be final
and not subject to revision. For January 2022, revised seasonal factors and seasonally adjusted
indexes for 2017 to 2021 were calculated and published. For series which are directly adjusted
using the Census X-13ARIMA-SEATS seasonal adjustment software, the seasonal factors for 2021 will
be applied to data for 2022 to produce the seasonally adjusted 2022 indexes. Series which are
indirectly seasonally adjusted by summing seasonally adjusted component series have seasonal
factors which are derived and are therefore not available in advance.
Determining Seasonal Status
Each year the seasonal status of every series is reevaluated based upon certain statistical
criteria. Using these criteria, BLS economists determine whether a series should change its
status from "not seasonally adjusted" to "seasonally adjusted", or vice versa. If any of the 81
components of the U.S. city average all items index change their seasonal adjustment status from
seasonally adjusted to not seasonally adjusted, not seasonally adjusted data will be used in the
aggregation of the dependent series for the last 5 years, but the seasonally adjusted indexes
before that period will not be changed. For 2022, 22 of the 81 components of the U.S. city
average all items index are seasonally adjusted.
Contact Information
For additional information about the CPI visit www.bls.gov/cpi or contact the CPI Information and
Analysis Section at 202-691-7000 or cpi_info@bls.gov.
For additional information on seasonal adjustment in the CPI visit
www.bls.gov/cpi/seasonal-adjustment/home.htm or contact the CPI seasonal adjustment section at
202-691-6968 or cpiseas@bls.gov.
If you are deaf, hard of hearing, or have a speech disability, please dial 7-1-1 to access
telecommunications relay services.
김대호 글로벌이코노믹 연구소장 tiger8280@g-enews.com