


;)
;)


미국 연준 FOMC 금리인상 "속도조절"
 이미지 확대보기
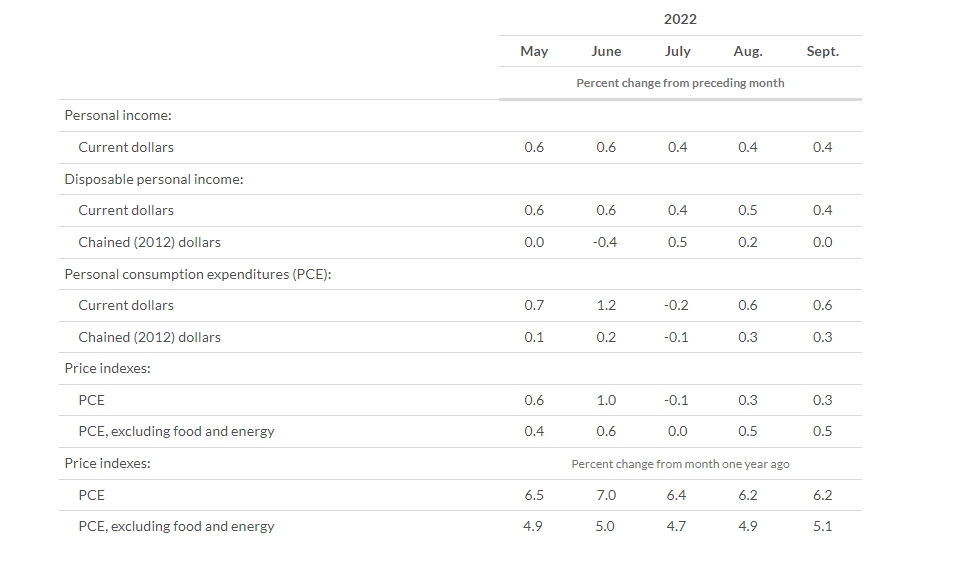
"PCE 인플레 9월 6.2%에서 10월 6%로 하락
"근원 PCE 인플레 9월 5.1%에서 10월 5.0% 로 완화"
미국의 CPI 소비자 물가에 이어 PCE 개인지출 물가는 지난 9월에 고공행진을 계속하고 근원물가는 오히려 더 올라간 바 있다. 이 상승세가 이번에는 다소 꺽인 것으로 보인다. "상승률 하락" 인플레 정점통과한것으로 나타나면서 뉴욕증시 비트코인 환호하고 있다.
PCE 물가지수는 9월에 6.2%로 전달과 같은 수준이었으며 식품과 에너지를 제외한 근원물가는 5.1%로 오히려 더 올라갔다. 대도시 물가를 표시하는 CPI, 소비자 물가에 이어 연준이 선호하는 미 전역의 PCE 물가도 9월에 큰 진전을 이루지 못했다. 10월에는 이 PCE 물가지수가 전년대비 6.0% 증가해 그 전달의 6.3%에 비해 낮아졌다. 근원 PCE 인플레도 9월 5.1%에서 10월 5.0% 로 완화됐다.
물가를 잡기를 위해 연방준비제도는 4연속 0.75 포인트를 포함해 5차례나 금리를 올렸다.
PCE 물가지수
A key measure of consumer prices slowed somewhat in October, another hopeful sign that inflation pressures could be moderating.
PCE is the Federal Reserve’s preferred inflation gauge since it gives a more complete picture of consumer prices.
Personal Income and Outlays, September 2022
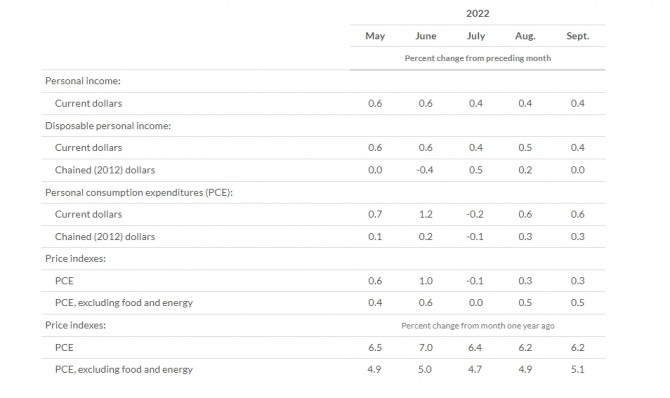
Personal income increased $78.9 billion (0.4 percent) in September, according to estimates released today by the Bureau of Economic Analysis (tables 3 and 5). Disposable personal income (DPI) increased $71.3 billion (0.4 percent) and personal consumption expenditures (PCE) increased $113.0 billion (0.6 percent).
The PCE price index increased 0.3 percent. Excluding food and energy, the PCE price index increased 0.5 percent (table 9). Real DPI increased less than 0.1 percent in September and Real PCE increased 0.3 percent; goods increased 0.4 percent and services increased 0.3 percent (tables 5 and 7).
2022
May June July Aug. Sept.
Percent change from preceding month
Personal income:
Current dollars 0.6 0.6 0.4 0.4 0.4
Disposable personal income:
Current dollars 0.6 0.6 0.4 0.5 0.4
Chained (2012) dollars 0.0 -0.4 0.5 0.2 0.0
Personal consumption expenditures (PCE):
Current dollars 0.7 1.2 -0.2 0.6 0.6
Chained (2012) dollars 0.1 0.2 -0.1 0.3 0.3
Price indexes:
PCE 0.6 1.0 -0.1 0.3 0.3
PCE, excluding food and energy 0.4 0.6 0.0 0.5 0.5
Price indexes: Percent change from month one year ago
PCE 6.5 7.0 6.4 6.2 6.2
PCE, excluding food and energy 4.9 5.0 4.7 4.9 5.1
The increase in current-dollar personal income in September primarily reflected increases in compensation and personal income receipts on assets (table 3). The increase in compensation was led by private wages and salaries. Within private wages and salaries, both services-producing industries and goods-producing industries increased. The increase in personal income receipts on assets reflected increases in both interest and dividend income.
The $113.0 billion increase in current-dollar PCE in September reflected an increase of $94.7 billion in spending for services and an increase of $18.3 in spending for goods (table 3). Within services, the leading contributors were housing and utilities (mainly housing), "other" services (mainly international travel), and transportation services (mainly air transportation). Within goods, increases in “other” nondurable goods (mainly prescription drugs) and motor vehicles and parts (mainly new motor vehicles) were partly offset by a decrease in gasoline and other energy goods. Detailed information on monthly PCE spending can be found on Table 2.3.5U.
Personal outlays increased $125.5 billion in September (table 3). Personal saving was $581.6 billion in September and the personal saving rate—personal saving as a percentage of disposable personal income—was 3.1 percent (table 1).
Prices
From the preceding month, the PCE price index for September increased 0.3 percent (table 9). Prices for goods decreased 0.1 percent, reflecting a decrease in prices for nondurable goods (led by gasoline and other energy goods). Prices for services increased 0.6 percent (led by housing and transportation services). Food prices increased 0.6 percent and energy prices decreased 2.4 percent. Excluding food and energy, the PCE price index increased 0.5 percent. Detailed monthly PCE price indexes can be found on Table 2.3.4U.
From the same month one year ago, the PCE price index for September increased 6.2 percent (table 11). Prices for goods increased 8.1 percent and prices for services increased 5.3 percent. Food prices increased 11.9 percent and energy prices increased 20.3 percent. Excluding food and energy, the PCE price index increased 5.1 percent from one year ago.
Real PCE
The 0.3 percent increase in real PCE in September reflected an increase of 0.4 percent in spending on goods and 0.3 percent in spending on services (table 7). Within goods, the increase primarily reflected an increase in spending on gasoline and other energy goods. Within services, "other" services (mainly international travel), food services and accommodations, and health care were the leading contributors. Detailed information on monthly real PCE spending can be found on Table 2.3.6U.
Updates to Personal Income and Outlays
Estimates have been updated for July and August. Revised and previously published changes from the preceding month for current-dollar personal income, and for current-dollar and chained (2012) dollar DPI and PCE, are provided below.
Change from preceding month
July August
Previous Revised Previous Revised Previous Revised Previous Revised
(Billions of dollars) (Percent) (Billions of dollars) (Percent)
Personal income:
Current dollars 75.1 85.8 0.3 0.4 71.6 84.0 0.3 0.4
Disposable personal income:
Current dollars 62.8 78.0 0.3 0.4 67.6 84.4 0.4 0.5
Chained (2012) dollars 68.3 81.1 0.5 0.5 11.8 28.7 0.1 0.2
Personal consumption expenditures:
Current dollars -34.8 -39.3 -0.2 -0.2 67.5 96.8 0.4 0.6
Chained (2012) dollars -11.8 -15.1 -0.1 -0.1 14.4 41.4 0.1 0.3
* * *
Next release: December 1, 2022, at 8:30 a.m. EST
Personal Income and Outlays, October 2022
뉴욕증시 주요 지표 및 연설 일정
2022년 12월1일= 11월 챌린저 감원보고서, 개인소비지출(PCE) 및 개인소득, 주간 신규 실업보험 청구자 수, S&P 글로벌 제조업 PMI, 공급관리협회(ISM) 제조업 PMI , 자동차 판매, 로리 로건 댈러스 연은 총재 연설, 미셸 보우만 연준 이사 연설, 마이클 바 연준 부의장 연설, 달러 제너럴, 울타 뷰티, 아메리칸 아웃도어 브랜즈, 크로거 등 실적 발표
12월2일= 고용보고서 11월 비농업 부문 신규 고용·실업률, 찰스 에번스 시카고 연은 총재 연설
뉴욕증시는 제롬 파월 연방준비제도(연준·Fed) 의장이 이르면 12월 회의에서 금리 인상의 속도를 늦출 수 있다고 언급해 큰 폭으로 올랐다.
30일(미 동부시간) 뉴욕증권거래소(NYSE)에서 다우존스30산업평균지수는 전장보다 737.24포인트(2.18%) 오른 34,589.77로 거래를 마쳤다. 스탠더드앤드푸어스(S&P)500지수는 전장보다 122.48포인트(3.09%) 상승한 4,080.11로, 나스닥지수는 484.22포인트(4.41%) 뛴 11,468.00으로 장을 마감했다. 뉴욕증시 투자자들은 파월 의장의 연설에 안도했다. 파월 의장은 이날 열린 브루킹스 연구소 주최 연설에서 "금리 인상 속도를 완화할 시기가 빠르면 12월에 올 수 있다"라고 말했다. 파월 의장은 그러나 "일부 진전에도 물가 안정을 회복하려면 갈 길이 멀다"라며 "물가 안정을 위해서는 한동안 제약적인 수준의 정책을 유지해야 할 필요가 있다"라고 강조했다.
김대호 글로벌이코노믹 연구소장 tiger8280@g-enews.com